Recommended reads

Most recent articles

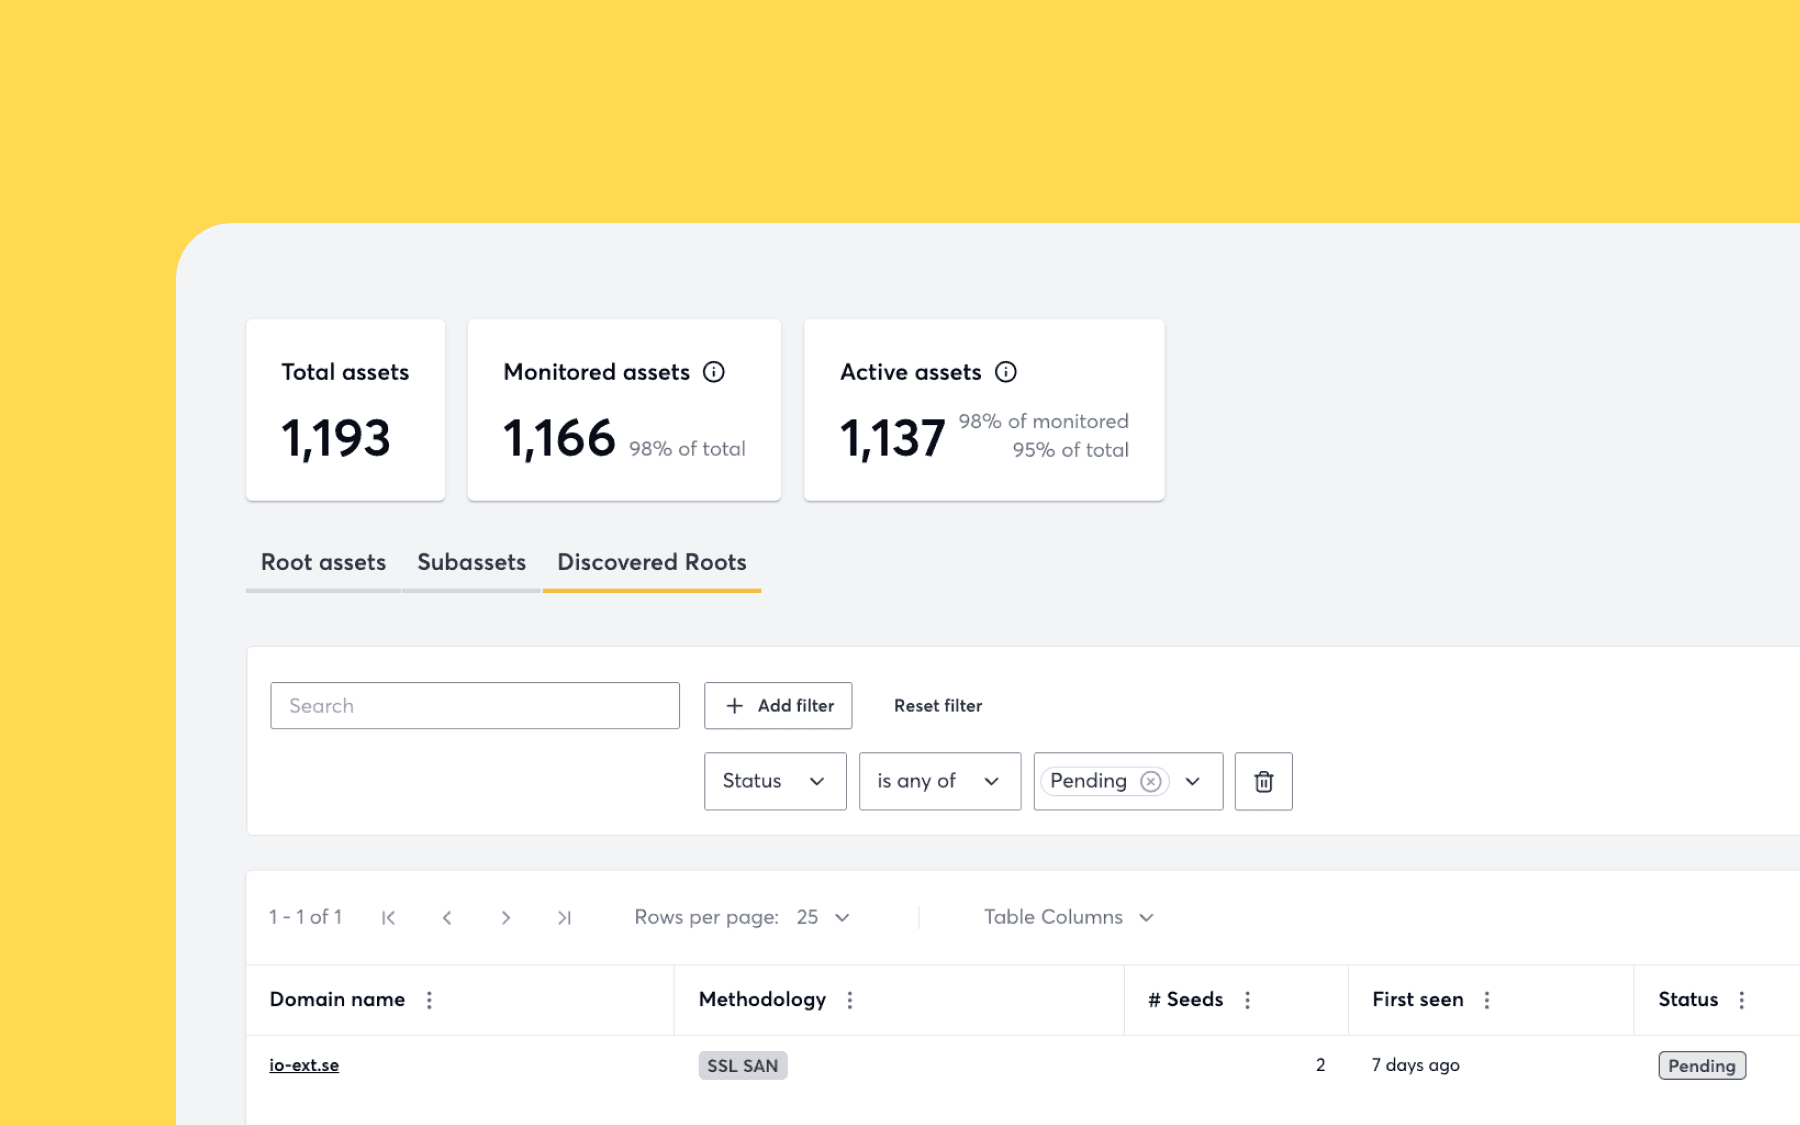
A Detectify UI dashboard displaying asset discovery metrics and a data table. At the top, three summary cards display metrics: "Total assets" at 1,193; "Monitored assets" at 1,166 (98% of total); and "Active assets" at 1,137 (98% of monitored, 95% of total). Below the cards, a navigation menu has tabs for "Root assets", "Subassets", and the currently selected "Discovered Roots". A filter section below the tabs shows a search bar and an active filter set to "Status is any of Pending". At the bottom, a data table shows a single row with the domain name "io-ext.se", discovered via the methodology "SSL SAN", with 2 seeds, first seen "7 days ago", and carrying a "Pending" status badge.